


This week’s FreightWaves Supply Chain Pricing Power Index: 30 (Shippers)
Last week’s FreightWaves Supply Chain Pricing Power Index: 30 (Shippers)
Three-month FreightWaves Supply Chain Pricing Power Index Outlook: 35 (Shippers)
The FreightWaves Supply Chain Pricing Power Index uses the analytics and data in FreightWaves SONAR to analyze the market and estimate the negotiating power for rates between shippers and carriers.
This week’s Pricing Power Index is based on the following indicators:
Withering on the vine
Ocean carriers are eyeing 2024 with no small amount of wariness, as the consensus seems to be that the waves will be choppy. Of course, the cargo handled by ocean carriers and container ports directly informs volume trends of the truckload market. Domestic manufacturers are also failing to inspire much optimism, as they foresee that a challenging interest rate environment will continue to be a major headwind on output throughout the first half of 2024.
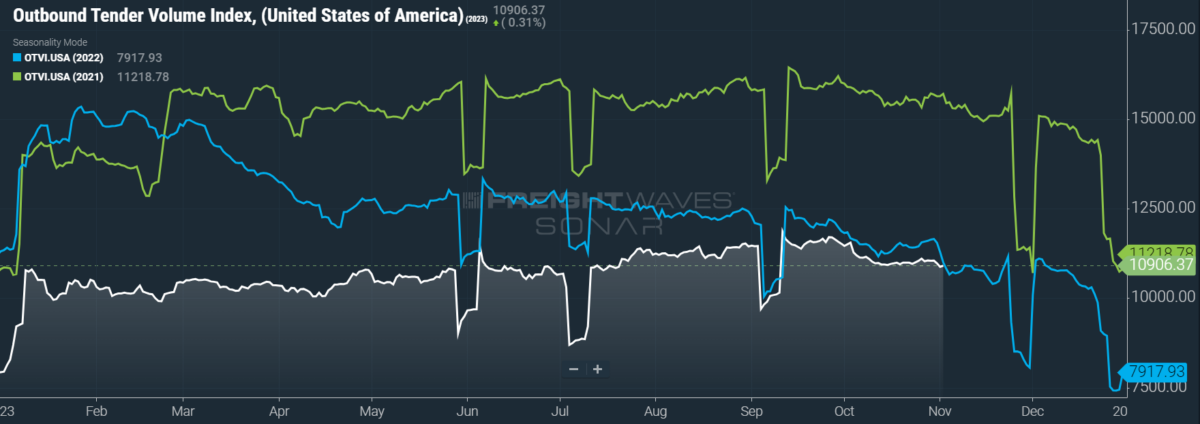
SONAR: OTVI.USA: 2023 (white), 2022 (blue) and 2021 (green)
To learn more about FreightWaves SONAR, click here.
This week, the Outbound Tender Volume Index (OTVI), which measures national freight demand by shippers’ requests for capacity, is down 1.77% week over week (w/w). On a year-over-year (y/y) basis, OTVI is finally up 0.81%, though such y/y comparisons can be colored by significant shifts in tender rejections. OTVI, which includes both accepted and rejected tenders, can be inflated by an uptick in the Outbound Tender Reject Index (OTRI).
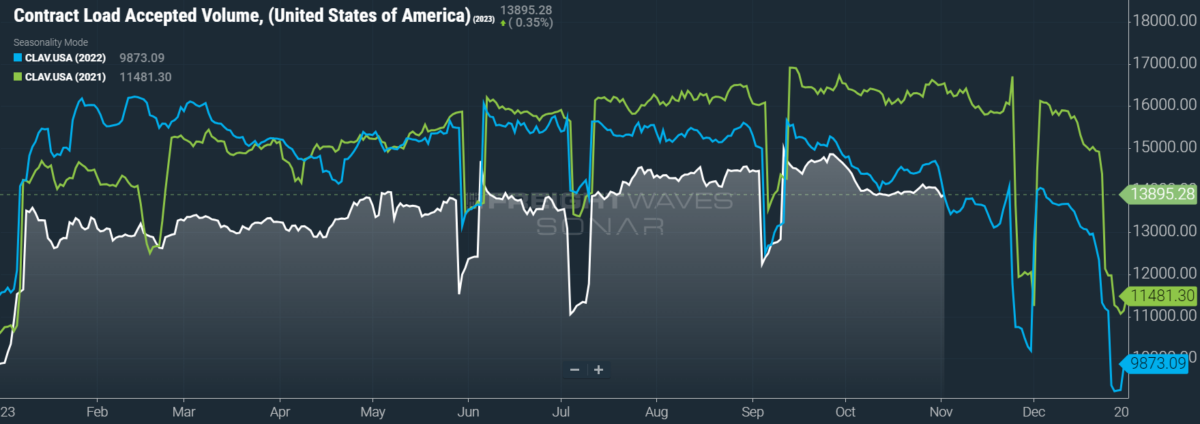
SONAR: CLAV.USA: 2023 (white), 2022 (blue) and 2021 (green)
To learn more about FreightWaves SONAR, click here.
Contract Load Accepted Volume is an index that measures accepted load volumes moving under contracted agreements. In short, it is similar to OTVI but without the rejected tenders. Looking at accepted tender volumes, we see a dip of 1.51% w/w as well as a fall of 2.61% y/y. This narrowing y/y difference implies that actual freight flow is still recovering from this cycle’s bottom.
With Friday’s release of the October jobs report came a startling realization that the labor market — what had been one of the strongest pillars beneath a slowing, but not crashing, economy — is on unstable ground. Nonfarm payrolls rose 150,000 in the month, below consensus estimates of 180,000 and nearly half of September’s growth, which was revised down from 336,000 to 297,000. I noted on the last jobs print that these headline figures follow a trend of quiet downward revisions in the months following, so for October’s initial pass to be below consensus is weak indeed.
The overall transportation and warehousing sector lost 12,100 jobs in October, which undid nearly all of September’s gain of 12,500 positions. Of October’s losses, cuts in the truck transportation subsector were a major factor, as the trucking industry lost 5,000 positions in the month. But the biggest blow by far was dealt by the storage and warehousing subsector, which bled 11,400 jobs in October. As the warehousing industry faces headwinds going into 2024, so also does the trucking industry.
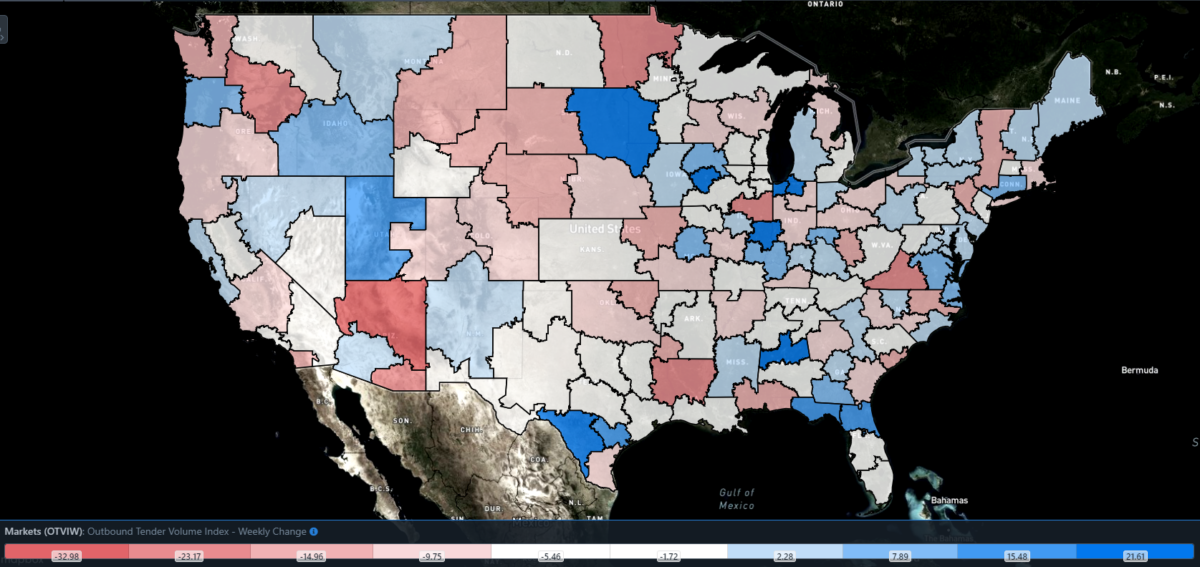
SONAR: Outbound Tender Volume Index – Weekly Change (OTVIW).
To learn more about FreightWaves SONAR, click here.
Of the 135 total markets, 55 reported weekly increases in tender volumes, with many of the heavyweight markets facing slight or severe losses on a w/w basis.
The razor’s edge
After a dramatic peak early last month that brought OTRI to its highest reading since January, tender rejections have returned to the path of mediocrity. As with spot rates, mid-May’s lows likely mark the bottom of this cycle. Unlike spot rates, however, the recent movements in national rejection rates do not have a significant impact on carriers’ sentiment — for them, tender rejections are at a good level, a bad one or a middling normal. Unfortunately, with OTRI below 4%, low rejection rates are still a heavy counterweight to carriers’ pricing power.
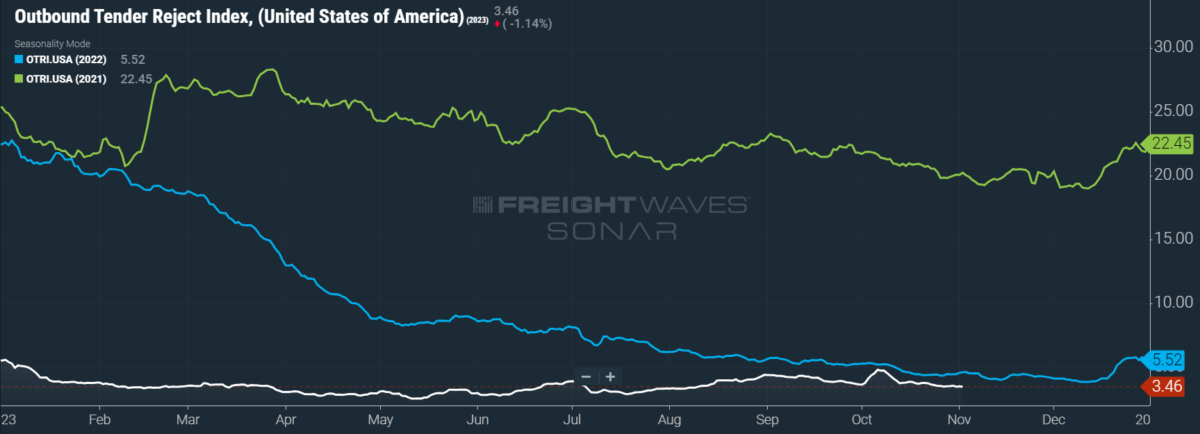
SONAR: OTRI.USA: 2023 (white), 2022 (blue) and 2021 (green)
To learn more about FreightWaves SONAR, click here.
Over the past week, OTRI, which measures relative capacity in the market, fell to 3.46%, a change of 6 basis points from the week prior. OTRI is now 113 bps below year-ago levels, with comparisons becoming less favorable as rejection rates slide deeper into contraction.
More news of bankruptcies came from the logistics sector, a further indication that this bloodletting cycle will be death by a thousand cuts. A 12-year-old brokerage in Fort Worth, Texas, SEL Supply Chain Solutions struggled to overcome a failure cascade that started with the theft of a $700,000 load earlier this year. After the cargo theft was reported to insurance, premiums predictably rose at a time when margins were already being compressed. Finally, the challenging credit environment caused banks to restrict the firm’s access to capital, which is especially damning for brokerages that rely on payments made 30-60 days after a load is moved. In short, this arduous road to freight markets’ recovery will punish brokers and carriers alike for any slight mistake or fluke disruption.
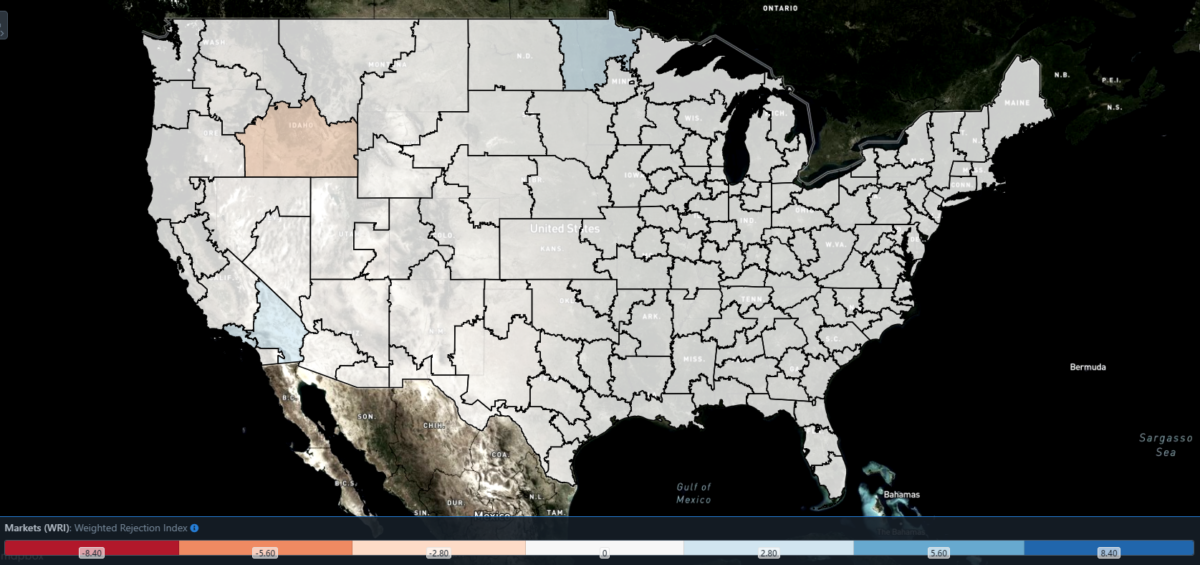
SONAR: WRI (color)
To learn more about FreightWaves SONAR, click here.
The map above shows the Weighted Rejection Index (WRI), the product of the Outbound Tender Reject Index – Weekly Change and Outbound Tender Market Share, as a way to prioritize rejection rate changes. As capacity is generally finding freight this week, only a few regions posted blue markets, which are usually the ones to focus on.
Of the 135 markets, 59 reported higher rejection rates over the past week, though 43 of those saw increases of only 100 or fewer bps.
Shifting sands
Diesel prices are headed back down after mid-October’s threat of a rally dissipated. The outbreak of war in the Middle East put a brief premium on prices of crude oil, though this fizzled as soon as the Israel-Hamas war appeared to be contained. That said, there are whispers that Saudi Arabia could cut its oil production by another million barrels per day. Such a strategy appears somewhat foolish, given recent Q3 data that revealed — as a direct result of already-curbed production — Saudi Arabia’s economy contracted for the first time since the beginning of 2021. If Saudi Arabia does decide to press its finger further on the scale, there is always the risk that oil markets could become too hot, triggering a recessionary backlash.
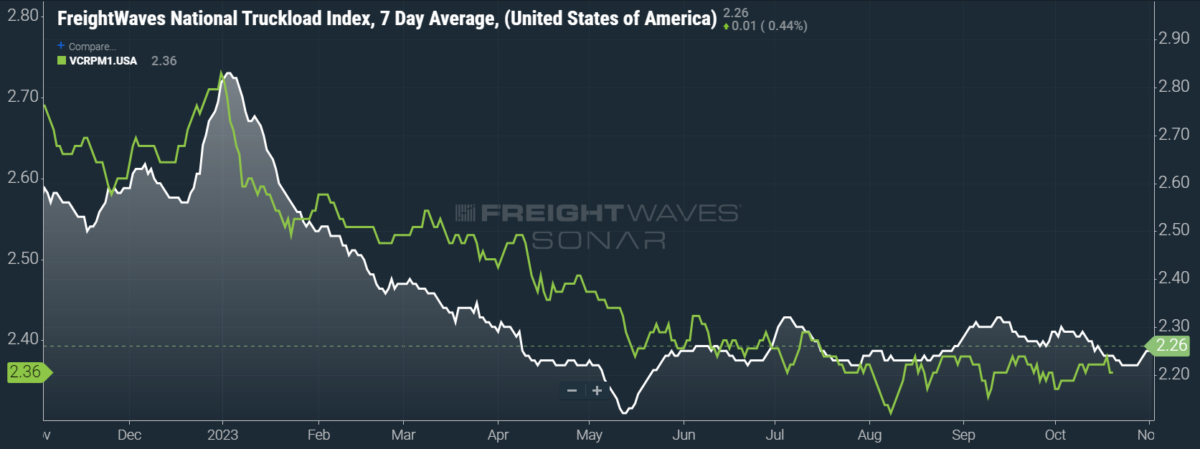
SONAR: National Truckload Index, 7-day average (white; right axis) and dry van contract rate (green; left axis).
To learn more about FreightWaves SONAR, click here.
This week, the National Truckload Index (NTI) — which includes fuel surcharges and other accessorials — rose 4 cents per mile to $2.26. Falling fuel prices were unable to offset rising linehaul rates, as the linehaul variant of the NTI (NTIL) — which excludes fuel surcharges and other accessorials — rose 5 cents per mile w/w to $1.57.
It is still difficult to discern the movements of contract rates, which are reported on a two-week delay, for the remainder of the year. Bid season is still ongoing and will continue until Q1 2024, but contract rates have so far remained stable. Even so, contract rates are trending slightly below last quarter’s average, and shippers have plenty of pricing power left to exercise during this round of contract negotiations. For the time being, contract rates — which exclude fuel surcharges and other accessorials like the NTIL — have fallen 1 cent per mile w/w to $2.36.
To learn more about FreightWaves SONAR, click here.
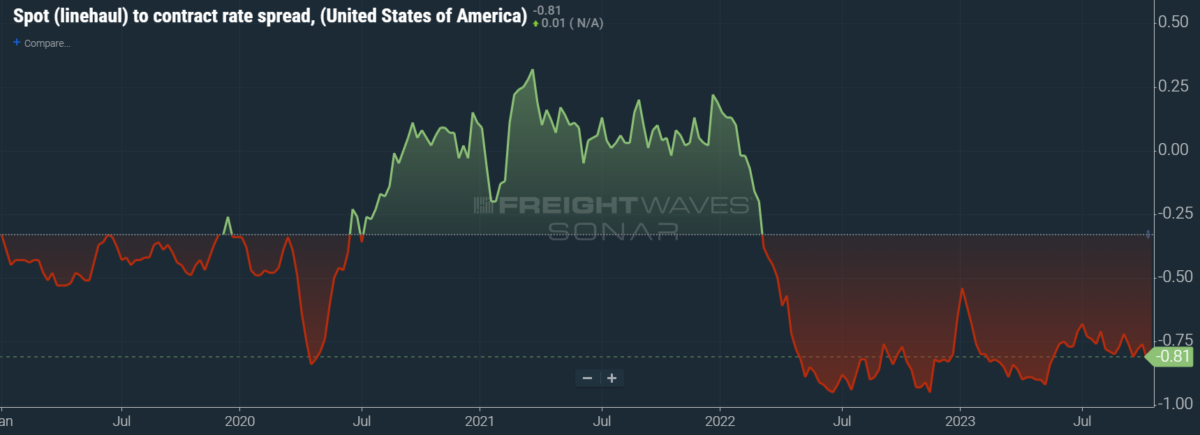
The chart above shows the spread between the NTIL and dry van contract rates, revealing the index has fallen to all-time lows in the data set, which dates to early 2019. Throughout that year, contract rates exceeded spot rates, leading to a record number of bankruptcies in the space. Once COVID-19 spread, spot rates reacted quickly, rising to record highs seemingly weekly, while contract rates slowly crept higher throughout 2021.
Despite this spread narrowing significantly early in the year, tightening by 20 cents per mile in January, it has remained wide throughout most of the year to date. As linehaul spot rates remain 81 cents below contract rates, there is plenty of room for contract rates to decline — or for spot rates to rise — in the final quarter of the year.
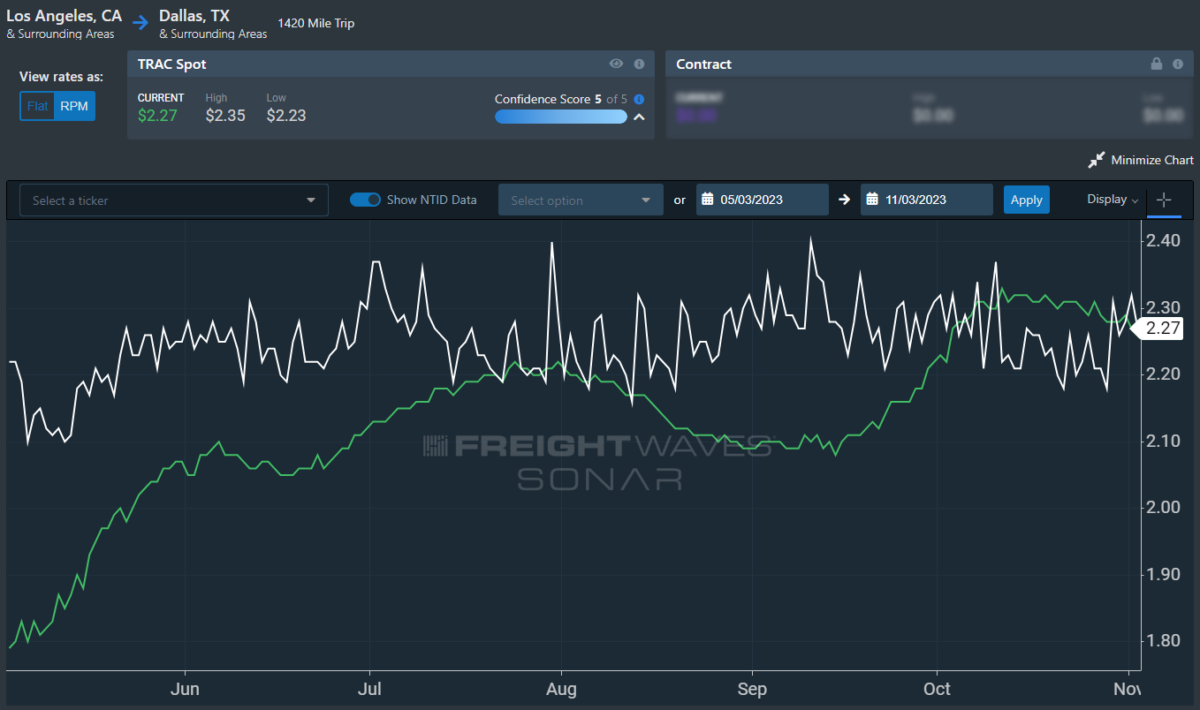
To learn more about FreightWaves TRAC, click here.
The FreightWaves Trusted Rate Assessment Consortium (TRAC) spot rate from Los Angeles to Dallas, arguably one of the densest freight lanes in the country, is losing some of its recent gains. Over the past week, the TRAC rate fell 4 cents per mile w/w to $2.27 — slipping further from its year-to-date high of $2.39. The daily NTI (NTID), which has risen to $2.27, is now realigned with rates along this lane.
To learn more about FreightWaves TRAC, click here.
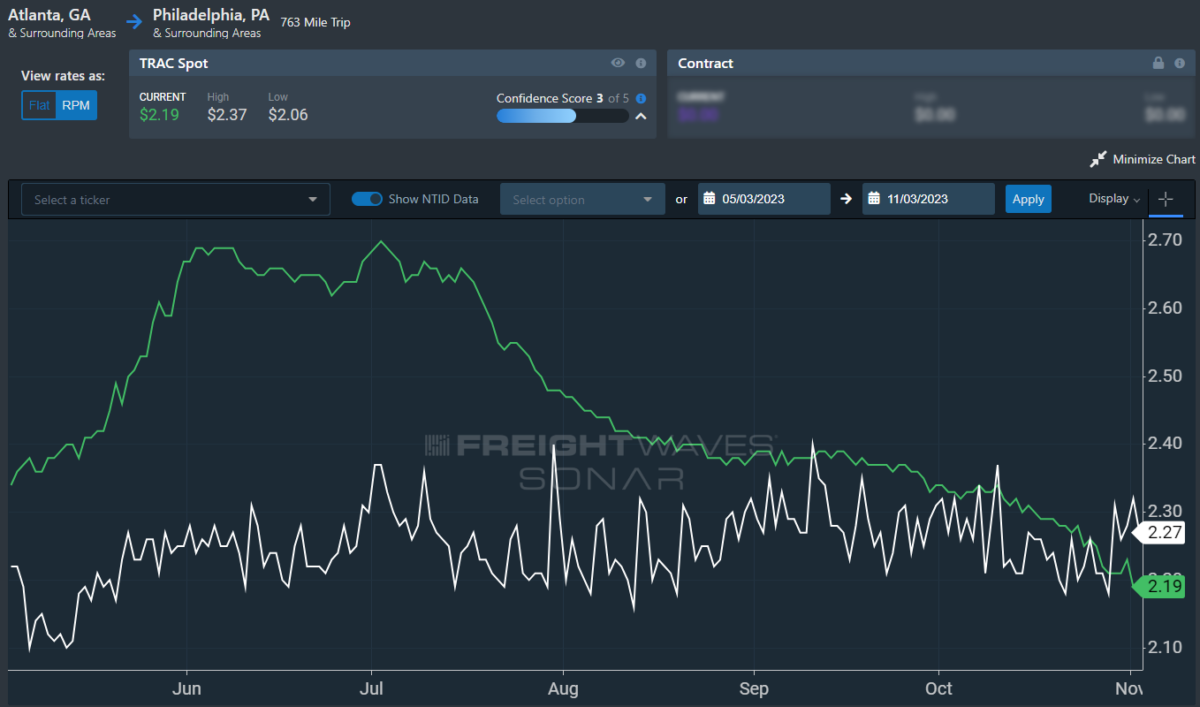
On the East Coast, especially out of Atlanta, rates are facing a brutal decline and are finally being outpaced by the NTID. The FreightWaves TRAC rate from Atlanta to Philadelphia fell 6 cents per mile to $2.19. After a bull run that started at the end of April, this lane had been plateauing well above the national average, which made north-to-south lanes in the East more attractive than West Coast alternatives during the summer.
For more information on FreightWaves’ research, please contact Michael Rudolph at [email protected] or Tony Mulvey at [email protected].