


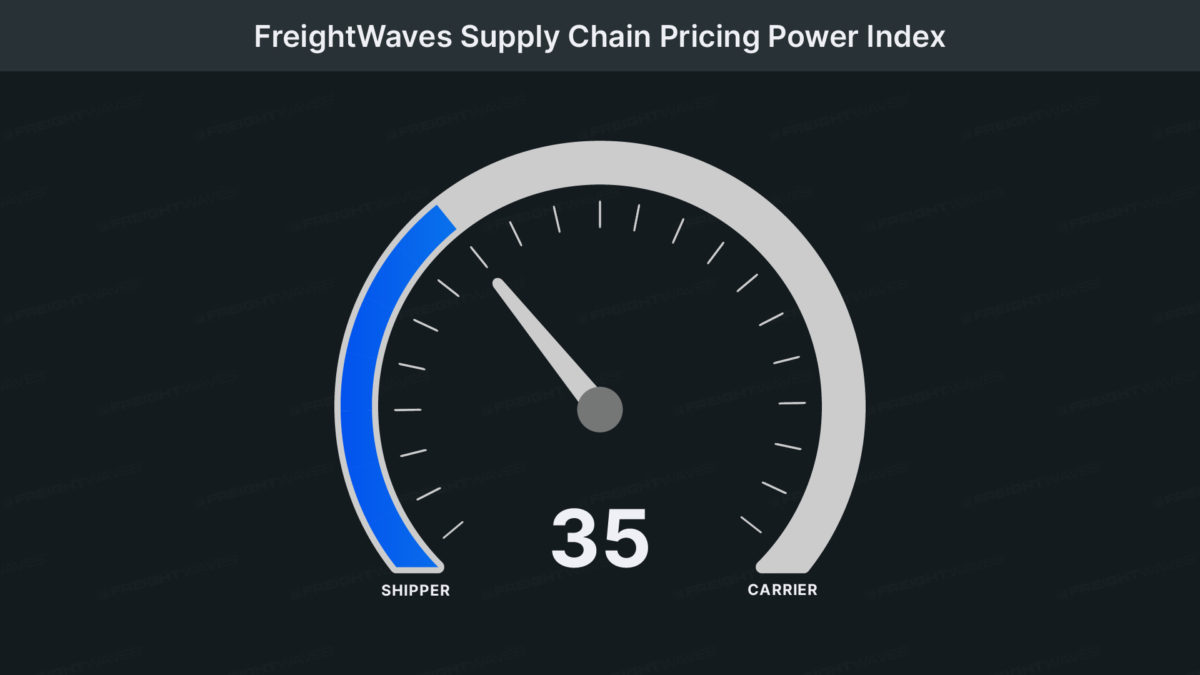
This week’s FreightWaves Supply Chain Pricing Power Index: 35 (Shippers)
Last week’s FreightWaves Supply Chain Pricing Power Index: 35 (Shippers)
Three-month FreightWaves Supply Chain Pricing Power Index Outlook: 35 (Shippers)
The FreightWaves Supply Chain Pricing Power Index uses the analytics and data in FreightWaves SONAR to analyze the market and estimate the negotiating power for rates between shippers and carriers.
This week’s Pricing Power Index is based on the following indicators:
Even-keeled
Volumes are leveling out at the start of December, delaying the seasonal dip that ordinarily occurs at this time of the year. Consequently, freight demand is outpacing trends from 2022 and 2019 alike, though market activity is still sluggish compared to the barn-burning years of 2020 and 2021. While the rest of the year should not hold too many surprises in terms of tender volumes, carriers will have a chance to gain pricing power when capacity tightens around the holidays.
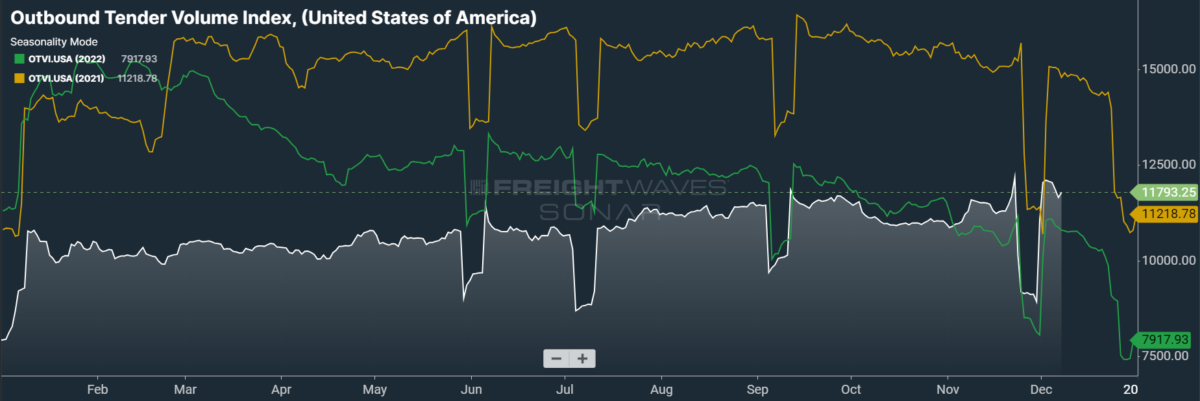
SONAR: OTVI.USA: 2023 (white), 2022 (green) and 2021 (orange)
To learn more about FreightWaves SONAR, click here.
This week, the Outbound Tender Volume Index (OTVI), which measures national freight demand by shippers’ requests for capacity, is up 6.51% week over week (w/w). On a year-over-year (y/y) basis, OTVI is up 9.33%, though such y/y comparisons can be colored by significant shifts in tender rejections. OTVI, which includes both accepted and rejected tenders, can be inflated by an uptick in the Outbound Tender Reject Index (OTRI).
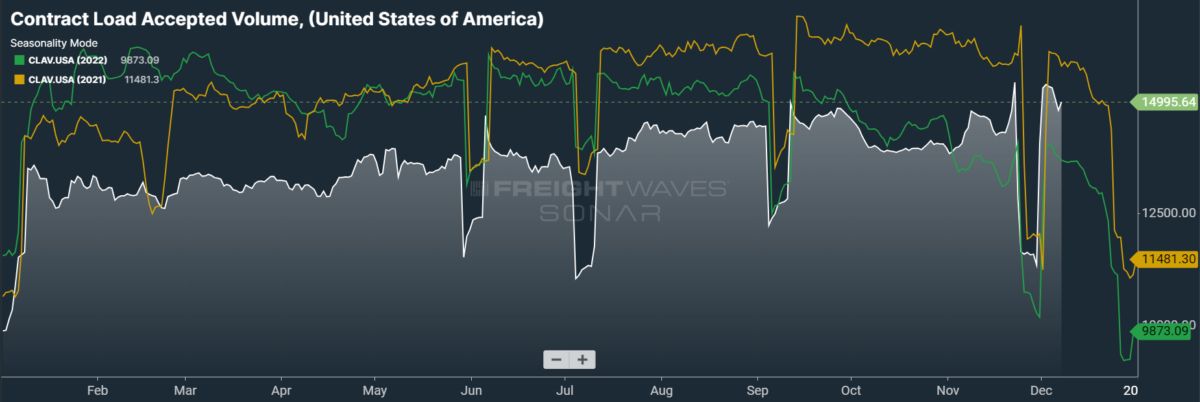
SONAR: CLAV.USA: 2023 (white), 2022 (green) and 2021 (orange)
To learn more about FreightWaves SONAR, click here.
Contract Load Accepted Volume is an index that measures accepted load volumes moving under contracted agreements. In short, it is similar to OTVI but without the rejected tenders. Looking at accepted tender volumes, we see a rise of both 30.41% w/w and of 7.51% y/y. Gaining distance over the previous year implies that actual freight flow is recovering from this cycle’s bottom.
While the industry clearly seems to be on the road to recovery, this road is shaping up to be longer and more arduous than many analysts previously expected. At a recent conference, industry leaders pointed out that seasonally informed growth would likely not be felt until midway through 2024. But others are taking a more pessimistic tack, suggesting that the growth stages of recovery could kick in as late as Q4 of next year.
For their part, shippers are exposing themselves to seasonality after years of struggling to insulate themselves against it. While the latest print of the Logistics Managers’ Index did see the headline index slip back into contraction following a three-month period of growth, it did so primarily because shippers are burning through their inventories. This signal is one of potential health for the coming year as shippers rely increasingly on just-in-time inventory strategies.
According to data from Adobe Analytics, consumer spending on Cyber Monday was up 9.6% over 2022 at $12.4 billion, as the top-selling categories included televisions, small kitchen appliances and beauty products. That said, Bank of America reports that clothing and department store spending was markedly negative on a yearly basis in the week of Black Friday, suggesting that consumers were more drawn to big-ticket items than smaller purchases. This trend might be a double-edged sword since, as Adobe Analytics reported, use of “buy now, pay later” programs was up a staggering 42.5% over 2022, which could be indicative of waning consumer health in the months to come.
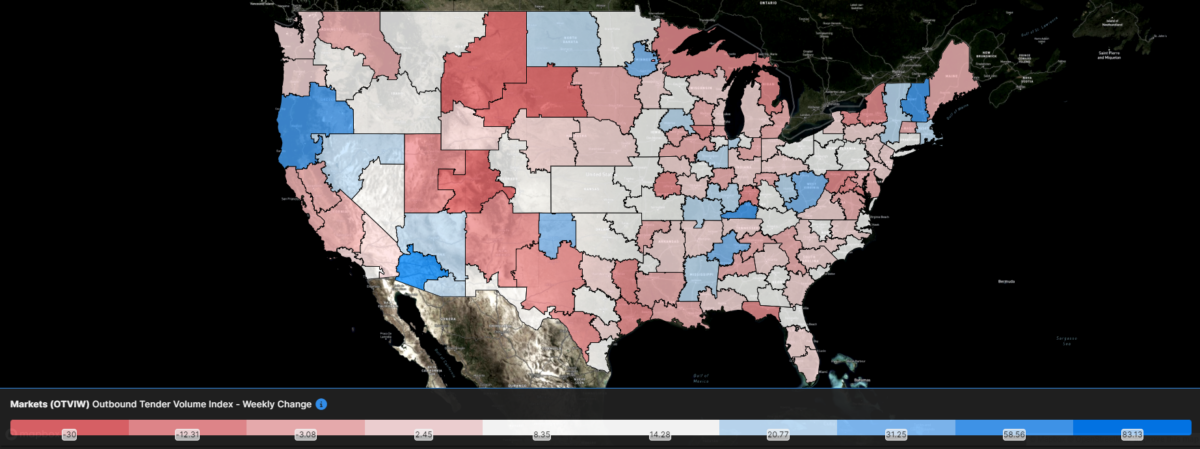
SONAR: Outbound Tender Volume Index – Weekly Change (OTVIW).
To learn more about FreightWaves SONAR, click here.
Of the 135 total markets, 101 reported weekly increases in tender volumes, with gains seen in markets along the Rust Belt, the mid-Atlantic and the Gulf Coast.
Plenty of diesel on demand
In last week’s column, the chaos of global oil markets was briefly summarized. In short, the Saudi-led OPEC+ revealed a potential disunity among members at their most recent meeting, jeopardizing the cartel’s ability to control oil prices. This void introduced by the production cuts of OPEC+ members is, surprisingly, being filled by domestic production. While U.S. producers have long declared their commitments to fiscal discipline and shareholder returns, the U.S. is once again shaping up to be a swing producer that sets the tone for markets. Crude exports from the U.S. are at all-time highs, headed to Europe and Asia alike.
Accordingly, oil prices are headed for their seventh consecutive weekly loss, with domestic prices slipping below $70 per barrel on Thursday. September’s threat of $100-per-barrel oil seems very distant indeed. Stocks of distillate fuels, including diesel, are trending slightly higher than forecast but are nevertheless below their five-year averages. With a warmer-than-average winter forecast for New England, it is unlikely that the region will run into any supply shocks that would spike diesel prices in the coming months.
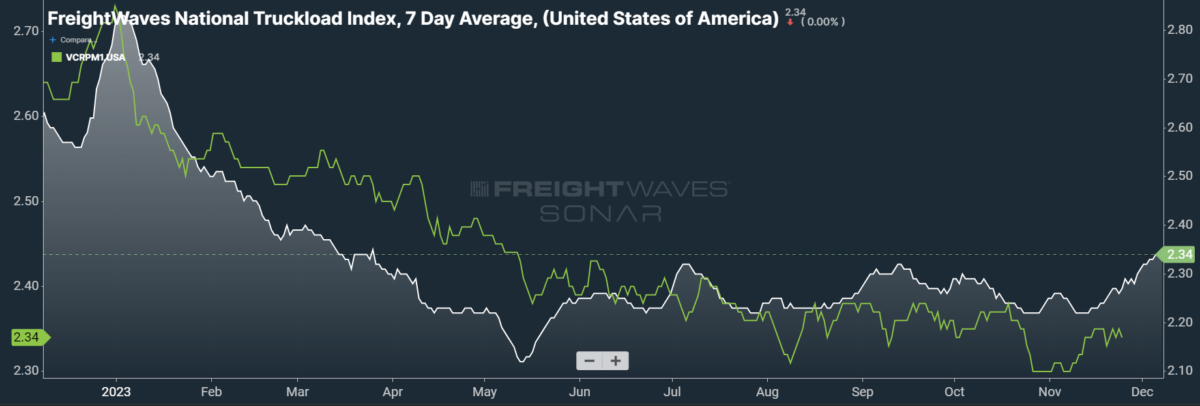
SONAR: National Truckload Index, 7-day average (white; right axis) and dry van contract rate (green; left axis).
To learn more about FreightWaves SONAR, click here.
This week, the National Truckload Index (NTI) — which includes fuel surcharges and other accessorials — rose 3 cents per mile to $2.34. Rising linehaul rates were wholly responsible for this week’s gains, as the linehaul variant of the NTI (NTIL) — which excludes fuel surcharges and other accessorials — rose 3 cents per mile w/w to $1.69.
Contract rates, which are reported on a two-week delay, did not see much activity in the week of Thanksgiving, remaining more or less where they have been for several weeks. As contract rate data extends into December, we should see a slight, stepwise decline before the holiday boost. Bid season is still ongoing, however, and shippers do possess plenty of unused pricing power. For the time being, contract rates — which exclude fuel surcharges and other accessorials like the NTIL — are down 1 cent per mile w/w at $2.34.
To learn more about FreightWaves SONAR, click here.
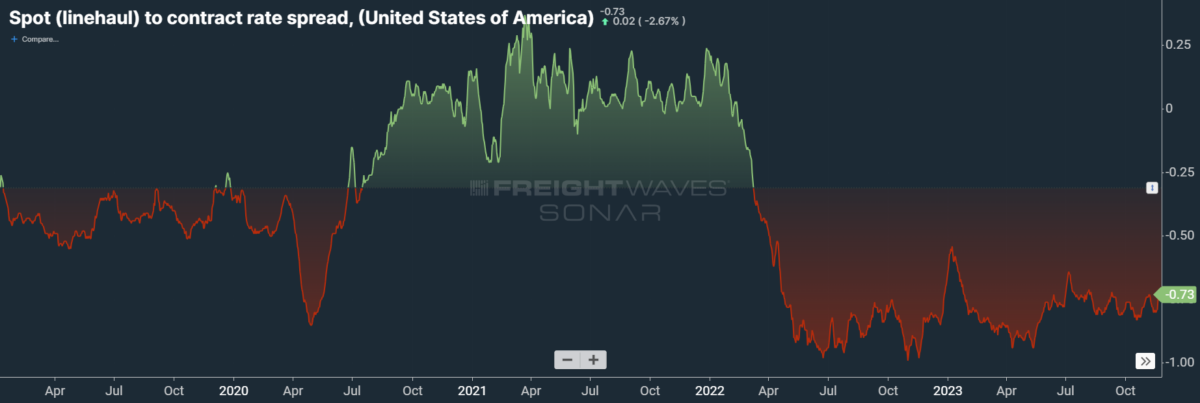
The chart above shows the spread between the NTIL and dry van contract rates, revealing the index has fallen to all-time lows in the data set, which dates to early 2019. Throughout that year, contract rates exceeded spot rates, leading to a record number of bankruptcies in the space. Once COVID-19 spread, spot rates reacted quickly, rising to record highs seemingly weekly, while contract rates slowly crept higher throughout 2021.
Despite this spread narrowing significantly early in the year, tightening by 20 cents per mile in January, it has remained wide throughout most of 2023. As linehaul spot rates remain 73 cents below contract rates, there is plenty of room for contract rates to decline — or for spot rates to rise — in the coming months.
To learn more about FreightWaves TRAC, click here.
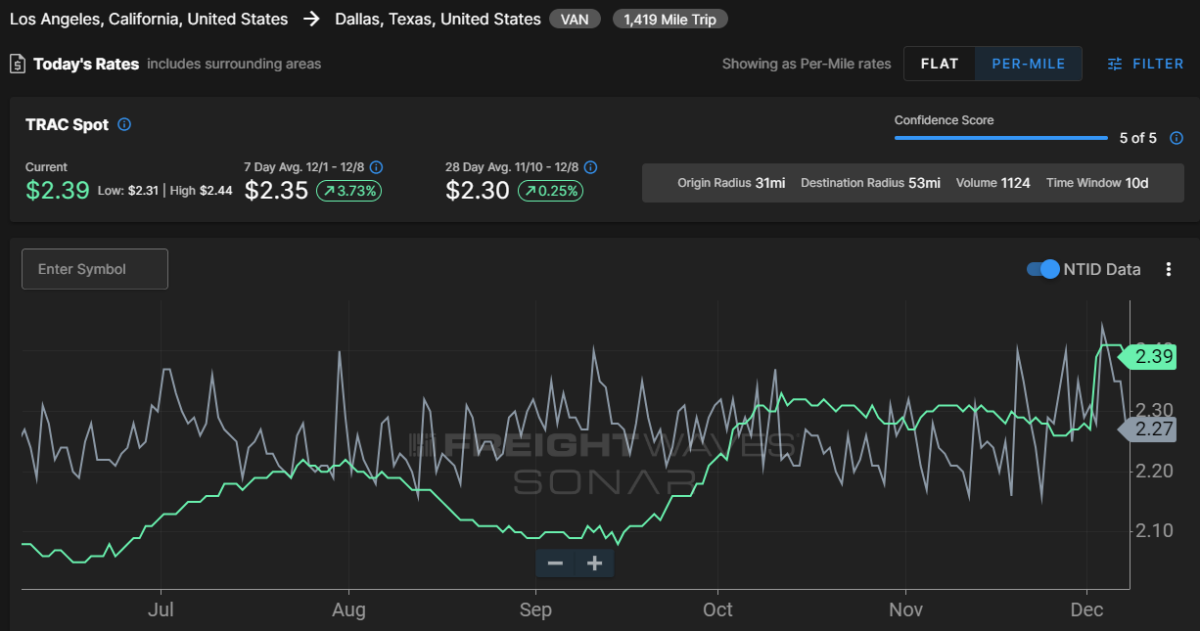
The FreightWaves Trusted Rate Assessment Consortium (TRAC) spot rate from Los Angeles to Dallas, arguably one of the densest freight lanes in the country, found a spring in its step to start the month. Over the past week, the TRAC rate rose 11 cents per mile w/w to $2.39 — setting a new year-to-date high of $2.41 earlier in the week. The daily NTI (NTID), which has fallen to $2.27, is again being outpaced by rates along this lane.
To learn more about FreightWaves TRAC, click here.
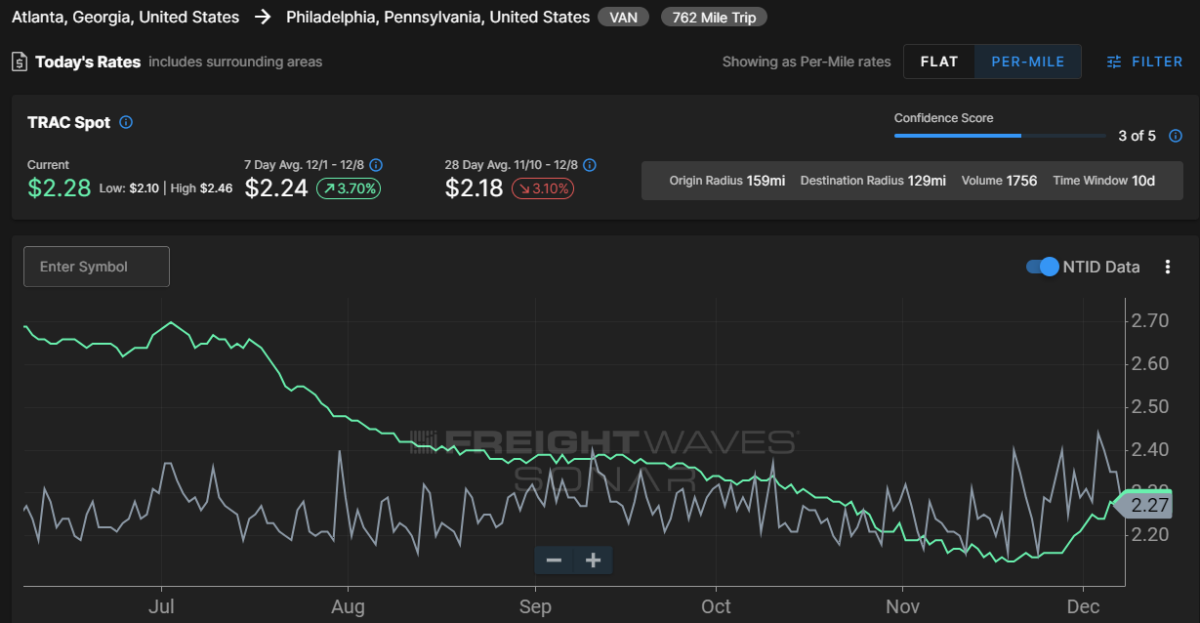
On the East Coast, especially out of Atlanta, rates saw a stark reversal of November’s losses but are still well below their Q3 average. The FreightWaves TRAC rate from Atlanta to Philadelphia shot up 7 cents per mile to $2.28. After plateauing well above the national average during the summer, rates along this lane declined sharply at the end of July, lacking any positive momentum until recently.
For more information on FreightWaves’ research, please contact Michael Rudolph at [email protected] or Tony Mulvey at [email protected].