


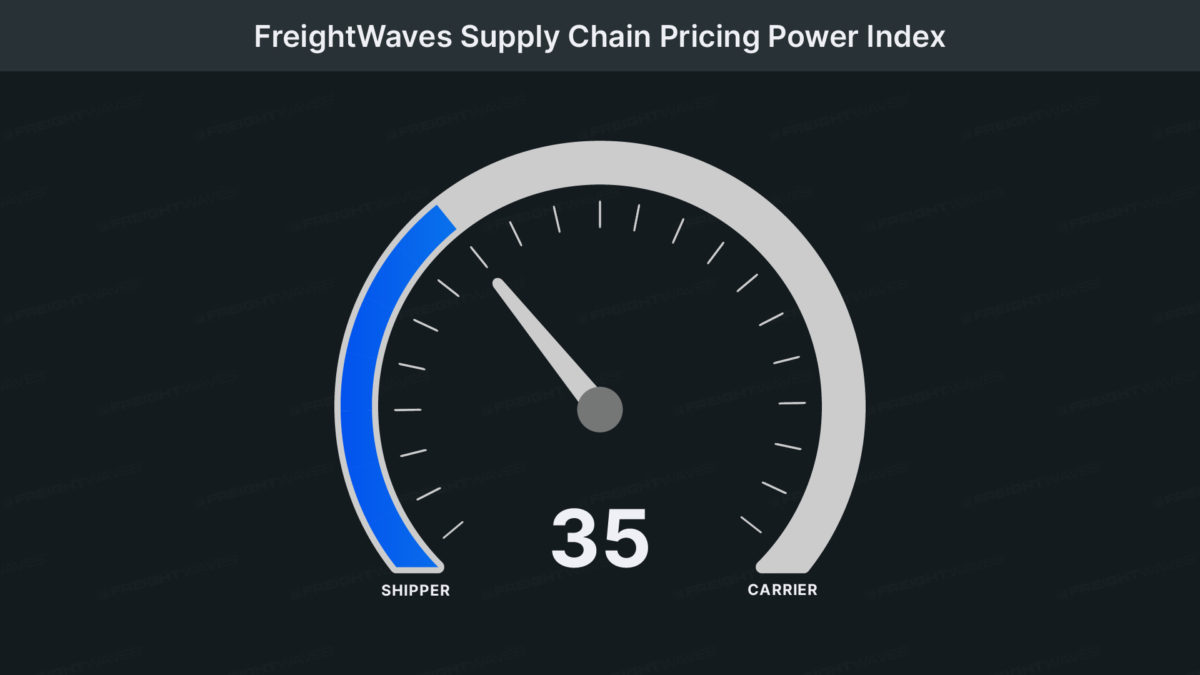
This week’s FreightWaves Supply Chain Pricing Power Index: 35 (Shippers)
Last week’s FreightWaves Supply Chain Pricing Power Index: 30 (Shippers)
Three-month FreightWaves Supply Chain Pricing Power Index Outlook: 35 (Shippers)
The FreightWaves Supply Chain Pricing Power Index uses the analytics and data in FreightWaves SONAR to analyze the market and estimate the negotiating power for rates between shippers and carriers.
This week’s Pricing Power Index is based on the following indicators:
Pre-Thanksgiving stuffing
The logistics world’s most exciting industry event has just come and gone. But while my back was turned this week, freight markets underwent a surprising rally that saw a wave of volumes sweep across the country. Interestingly enough, many of the largest markets were relatively stagnant or even in decline this week — with a few notable exceptions.
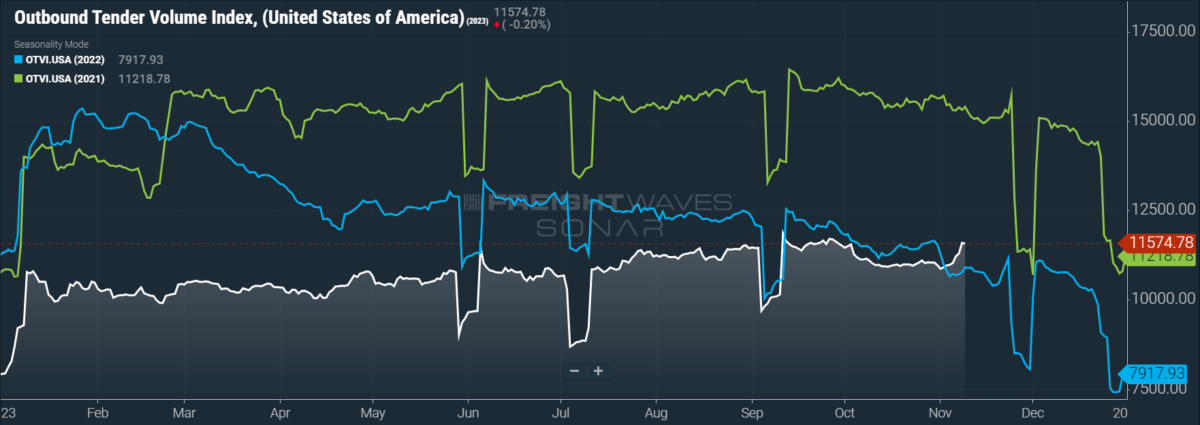
SONAR: OTVI.USA: 2023 (white), 2022 (blue) and 2021 (green)
To learn more about FreightWaves SONAR, click here.
This week, the Outbound Tender Volume Index (OTVI), which measures national freight demand by shippers’ requests for capacity, is up 6.13% week over week (w/w). On a year-over-year (y/y) basis, OTVI is finally up 6.2%, though such y/y comparisons can be colored by significant shifts in tender rejections. OTVI, which includes both accepted and rejected tenders, can be inflated by an uptick in the Outbound Tender Reject Index (OTRI).
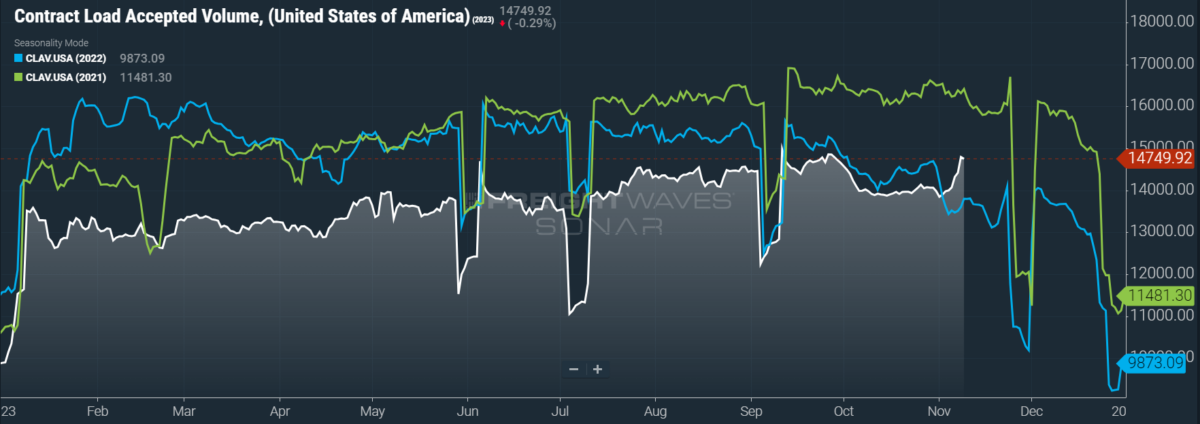
SONAR: CLAV.USA: 2023 (white), 2022 (blue) and 2021 (green)
To learn more about FreightWaves SONAR, click here.
Contract Load Accepted Volume is an index that measures accepted load volumes moving under contracted agreements. In short, it is similar to OTVI but without the rejected tenders. Looking at accepted tender volumes, we see a rise of both 6.83% w/w and of 8.75% y/y. This narrowing y/y difference implies that actual freight flow is recovering from this cycle’s bottom.
The industry is indeed recovering, as can be seen from October’s incredible surge in containerized imports. Per data from Descartes Systems Group, imports were up 3.9% y/y in October and 4.7% over September, making for the third-best October on record (behind the obvious front-runners, 2020 and 2021). This surge — particularly the Port of Los Angeles’ 81% increase in imports from Oct. 26 to Nov. 2 — fed truckload markets like a goose bred for foie gras. Truckload volumes in Ontario, California, a heavyweight market that houses and distributes the lion’s share of Los Angeles’ and Long Beach’s imports, are up a staggering 26% w/w.
But as much as I would wish otherwise, the caveats must be restated. First, October’s growth was heavily driven by exports from China. As we have previously noted, China halted or curbed exports at the beginning of October during the national celebration of Golden Week. Taking into account the lead times, transit times and potential delays at either the port of discharge or lading, this disruption will not hit U.S. shores until next week. So by all means, smoke ’em while you’ve got ’em, but the winter is about to hit truckload markets sooner rather than later.
Second, ocean carriers are bracing for unfavorable trade winds that are forecast to persist well into 2024 if not beyond. After a brutal third-quarter earnings miss, Hapag-Lloyd — the world’s fifth-largest ocean carrier — tightened its guidance for the remainder of the year. Rolf Habben Jensen, CEO of Hapag-Lloyd, identified the problem not as volume weakness but as overcapacity driving down rates. “We do not expect a dramatic recovery of demand in the next couple of quarters,” Habben Jensen said. “The macro environment remains challenging, there are two wars going on, interest rates are still pretty high, inflation is higher than it should be, and investor sentiment is not great.”
This outlook is equally applicable to truckload markets, insofar as they are both fed by maritime imports and are also suffering from overcapacity driving down rates. As we will note below, even a 10% increase in actual volumes is not nearly enough to compensate for the lingering aftereffects of the past few years’ freight gold rush. In fact, this problem might be extended by struggling carriers being thrown a lifeline by an all-too-brief surge in volumes.
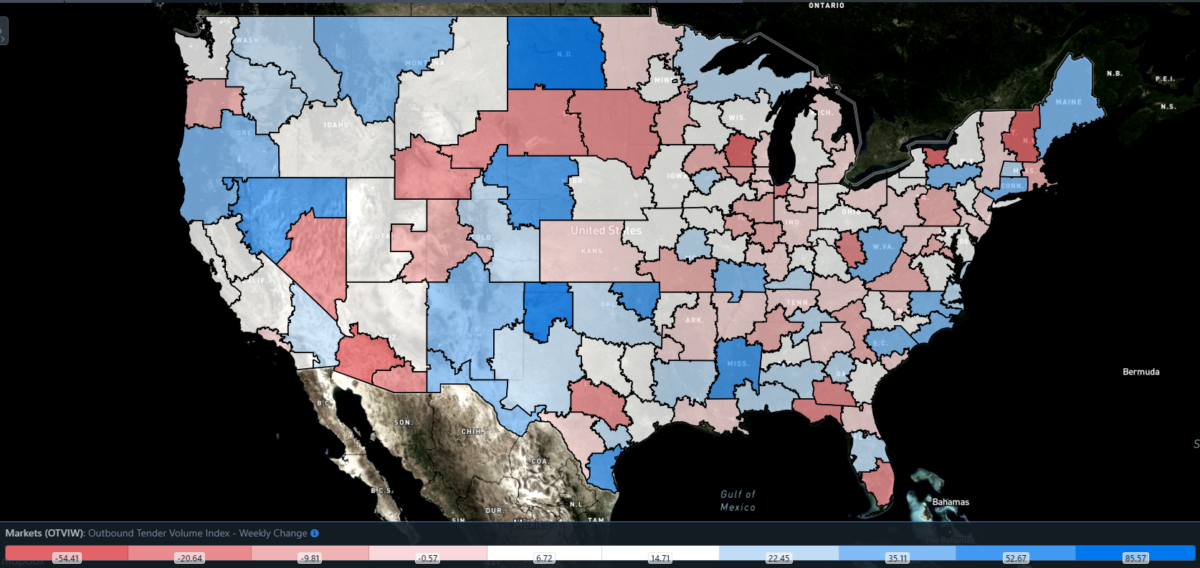
SONAR: Outbound Tender Volume Index – Weekly Change (OTVIW).
To learn more about FreightWaves SONAR, click here.
Of the 135 total markets, 103 reported weekly increases in tender volumes, with gains seen in markets along the Rust Belt, the mid-Atlantic and the Gulf Coast.
Time to get medieval
All of the good news concerning volumes is almost canceled out by the intractable stagnation of rejection rates. If anything, the current uptick in freight demand shows just how impossibly far volumes need to rise in order to keep everyone in the market. Unfortunately, the more likely scenario is that carriers continue to exit the industry during the upcoming quiet season of Q1. Bloodletting as the best solution is a sad reality, but it is reality nonetheless.
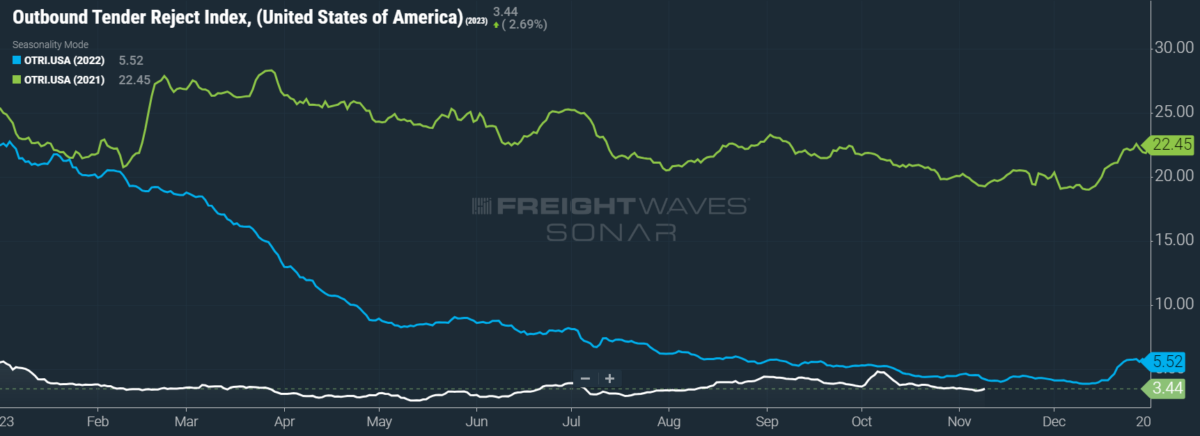
SONAR: OTRI.USA: 2023 (white), 2022 (blue) and 2021 (green)
To learn more about FreightWaves SONAR, click here.
Over the past week, OTRI, which measures relative capacity in the market, fell to 3.44%, a change of 2 basis points from the week prior. OTRI is now 75 bps below year-ago levels, with y/y comparisons becoming more favorable even if OTRI just remains more or less stable.
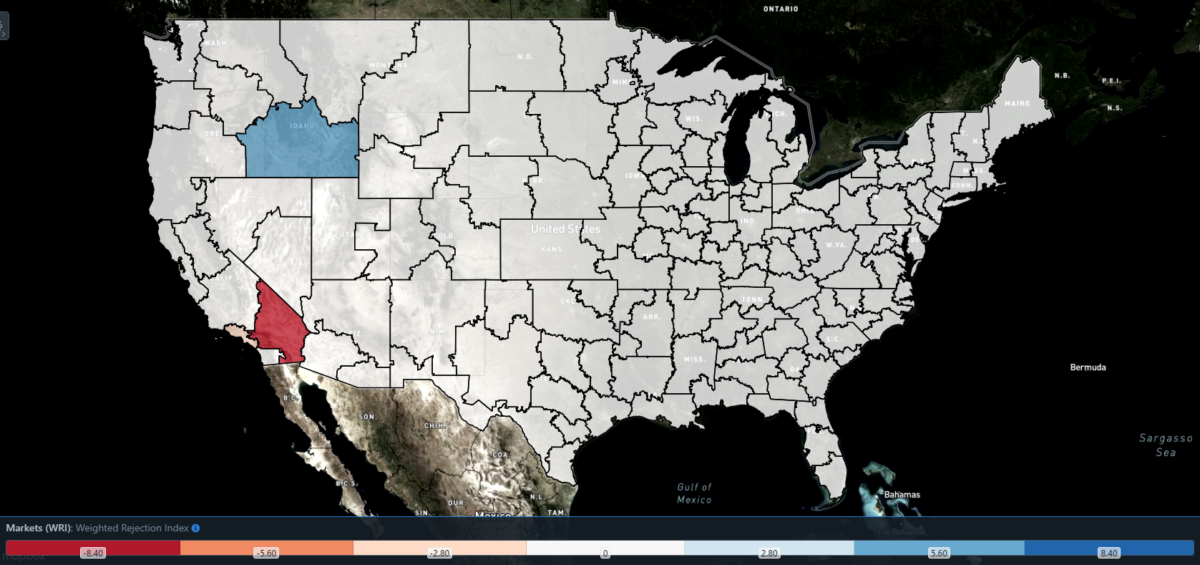
SONAR: WRI (color)
To learn more about FreightWaves SONAR, click here.
The map above shows the Weighted Rejection Index (WRI), the product of the Outbound Tender Reject Index – Weekly Change and Outbound Tender Market Share, as a way to prioritize rejection rate changes. As capacity is generally finding freight this week, only one region posted a blue market, which are usually the ones to focus on.
Of the 135 markets, 65 reported higher rejection rates over the past week, though 39 of those saw increases of only 100 or fewer bps.
Quo vadis, contract rates?
As rejection rates go, so also do spot rates, given that both reflect carriers’ leverage in choosing which freight they haul. But contract rates also suffered a brutal drubbing near the end of Q4’s first month. While nearly every quarter sees a surprise but brief dip in contract rates, not all of them are indicative of those rates’ pace for the rest of the quarter. Yet market dynamics fully support a sustained decline in contract rates, especially relative to spot rates as the spread between the two remains very wide.
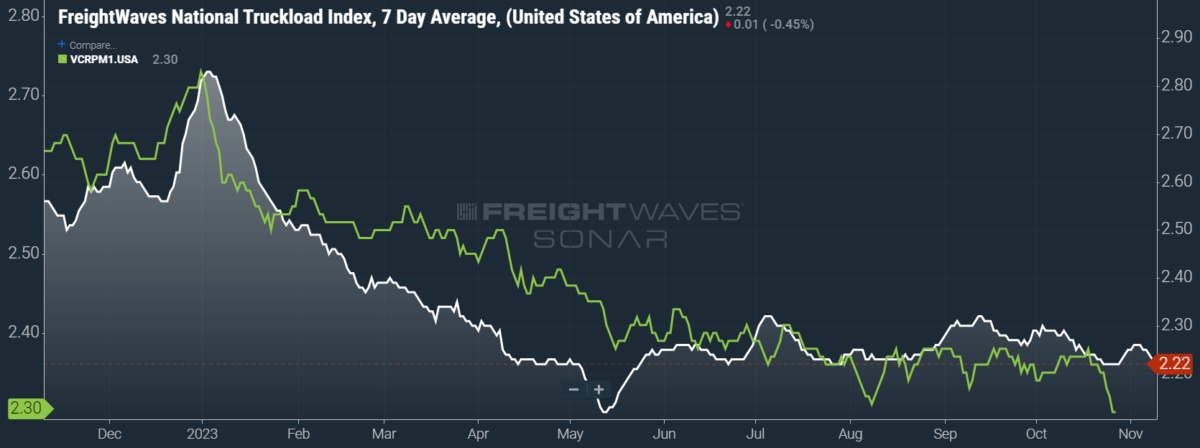
SONAR: National Truckload Index, 7-day average (white; right axis) and dry van contract rate (green; left axis).
To learn more about FreightWaves SONAR, click here.
This week, the National Truckload Index (NTI) — which includes fuel surcharges and other accessorials — fell 4 cents per mile to $2.22. Falling fuel prices added to losses in linehaul rates, as the linehaul variant of the NTI (NTIL) — which excludes fuel surcharges and other accessorials — fell 3 cents per mile w/w to $1.54.
As mentioned previously, the recent nosedive in contract rates — which are reported on a two-week delay — should not be prematurely taken as a firm signal for their Q4 direction. Bid season will continue over the next few months, and carriers might still be able to find some extra leverage under the couch cushions, especially if spot rates see a dramatic rise during the upcoming holidays. For the time being, however, contract rates — which exclude fuel surcharges and other accessorials like the NTIL — have tumbled 6 cents per mile w/w to $2.30.
To learn more about FreightWaves SONAR, click here.
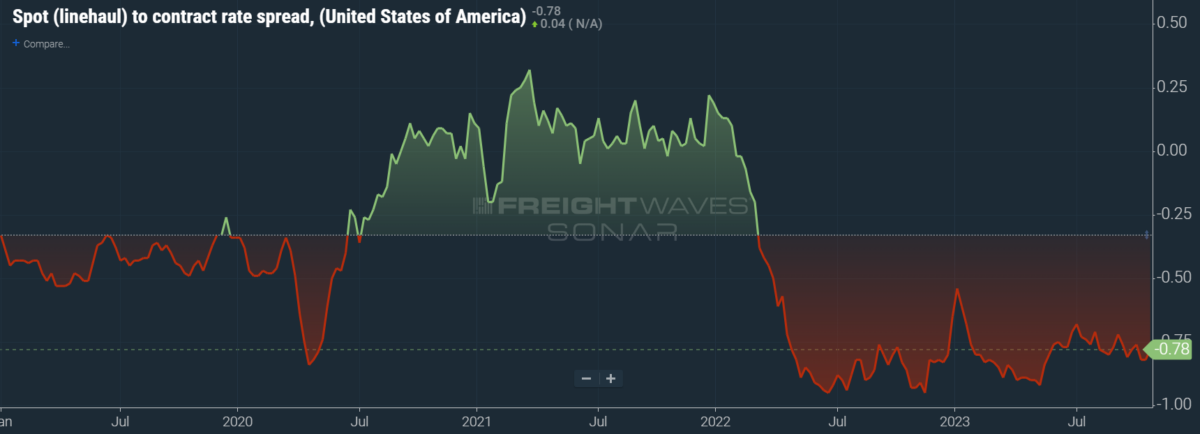
The chart above shows the spread between the NTIL and dry van contract rates, revealing the index has fallen to all-time lows in the data set, which dates to early 2019. Throughout that year, contract rates exceeded spot rates, leading to a record number of bankruptcies in the space. Once COVID-19 spread, spot rates reacted quickly, rising to record highs seemingly weekly, while contract rates slowly crept higher throughout 2021.
Despite this spread narrowing significantly early in the year, tightening by 20 cents per mile in January, it has remained wide throughout most of the year to date. As linehaul spot rates remain 78 cents below contract rates, there is plenty of room for contract rates to decline — or for spot rates to rise — in the final quarter of the year.
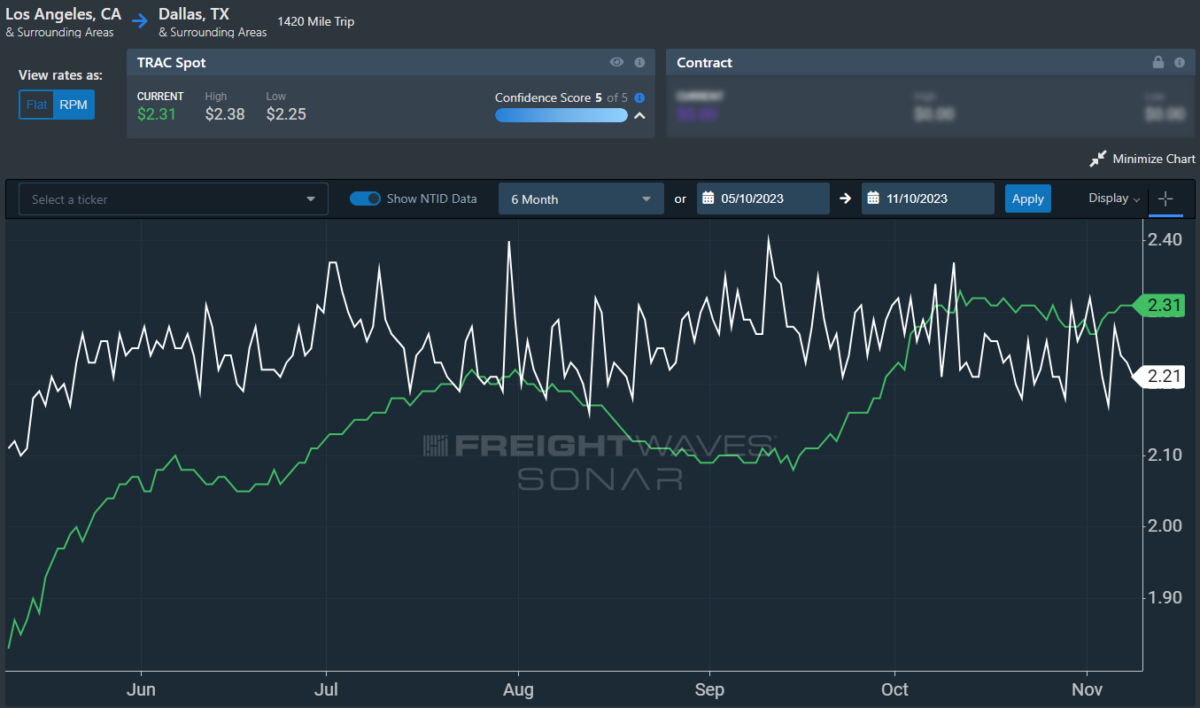
To learn more about FreightWaves TRAC, click here.
The FreightWaves Trusted Rate Assessment Consortium (TRAC) spot rate from Los Angeles to Dallas, arguably one of the densest freight lanes in the country, bounced back from a recent dip. Over the past week, the TRAC rate rose 4 cents per mile w/w to $2.31 — bearing down on its year-to-date high of $2.39. The daily NTI (NTID), which has fallen to $2.21, is again outpaced by rates along this lane.
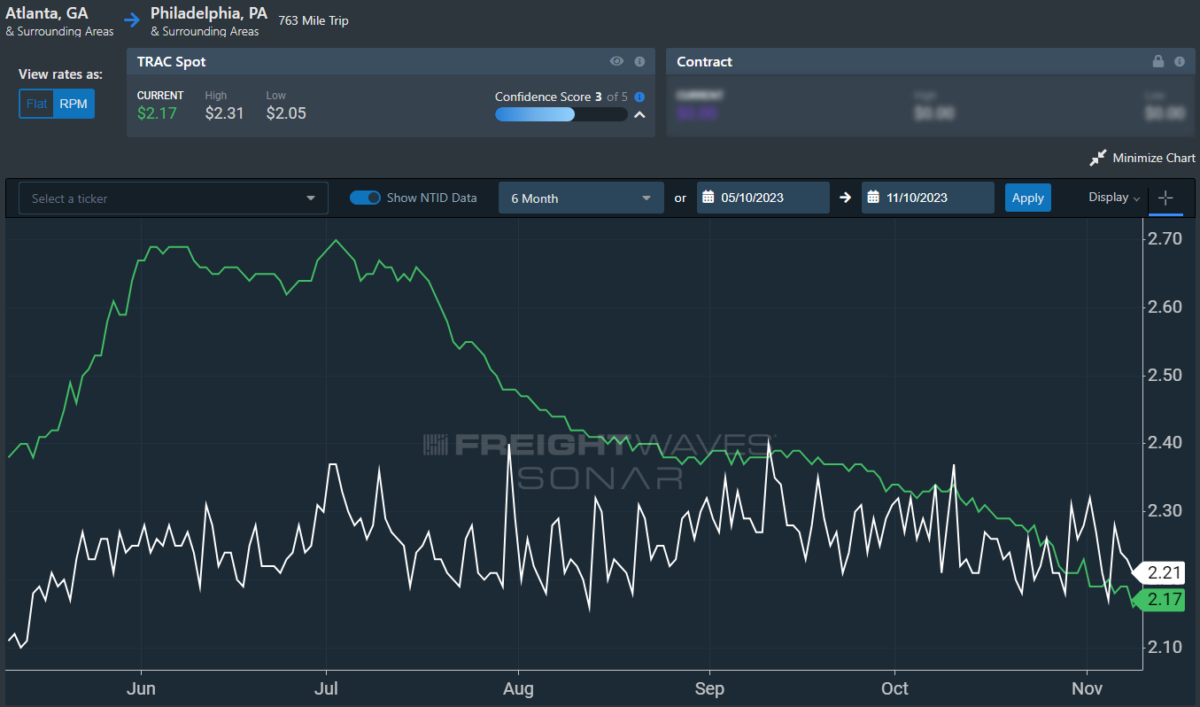
To learn more about FreightWaves TRAC, click here.
On the East Coast, especially out of Atlanta, rates are facing a protracted decline and are finally being outpaced by the NTID. The FreightWaves TRAC rate from Atlanta to Philadelphia fell 2 cents per mile to $2.17. After a bull run that started at the end of April, this lane had been plateauing well above the national average, which made north-to-south lanes in the East more attractive than West Coast alternatives during the summer.
For more information on FreightWaves’ research, please contact Michael Rudolph at [email protected] or Tony Mulvey at [email protected].
George Smith
@Johnny Freight you clearly have no clue to what you talking about. This comment is laughable.
Chris
Johnny Freights comment is laughable. While those other professions are important, except brokers, those firemen and doctors wouldn’t have anything to be a doctor or fireman without trucks. Where they gonna get their equipment and supplies, horse and buggy. And trucking is exempt from US Labor laws and we do so much work for free where that would be illegal in every single profession. Brokers are nothing more than a middle man and used to be illegal till the government allowed it back in the 80’s.
I noticed
Wherever a truck driver goes he’s being sued for something. Like your being sued for being in their lot. When you park in a strip mall to eat Wendy’s
Zud
All this data I read I would assume would not include frieght moving under contract and not visible data on the market as whole? So it would be just a snap shot of broker frieght? Just curious?
Johnny Freight
Brokers, docters, fireman, these are professins we need the most. Truck drivers need to stop been so greedy.